$ARCH Spaces Prep
Some Updated Modeling before Spaces
I know, I know, I’m starting to publish more frequently than the sell-side on this stock… but I am hosting a Twitter Spaces with the Coal Trader and wanted to give everybody some numbers to chew on before the call. This post looks really long but it’s basically just teeing up a bunch of different model scenarios, so you can get through it in 5-10 minutes.
A representative Base, Bear and Bull Case for 2022 Met pricing, and what that means for free cash flow and price targets
Why a languishing share price could very easily alleviate lower Met Coal realizations
The inevitable decline of China CFR indices from the $600 range has certainly spooked some market participants, even though prices have seemed to find a bottom in the low $300s of late (which by the way is still the top percentile of pricing, EVER!). There is no longer a huge arb versus the Australian index, with January futures at $318 for the DCE China coking index and $338 for the SGX Australian index.
We will get into the drivers below, but the short-lived opening of Mongolian borders, release of some previously held Australian inventory and continued weakness of Chinese Steel production all contributed. As fast as these contributed to a sharp drawdown in pricing, we have now had the Mongolian borders once again restricted and weather events in both British Columbia and Queensland contributing to prolong the period of “I thought Met pricing could never sustain this level” even further. Every day that pricing prints a 3-handle is a very good day for ARCH.
In any event, this has all led to a bearish sentiment shift on ARCH, to the extent that the SEVERAL HUNDRED MILLION DOLLAR improvement in Thermal prospects revealed on the 3rd quarter call has not only avoided being priced into the stock, but ARCH is actually lower since the earnings call. With that, I wanted to run through a Base, Bear and Bull Case for Met Coal pricing in 2022 and show how that impacts the model and price target.
Base Case
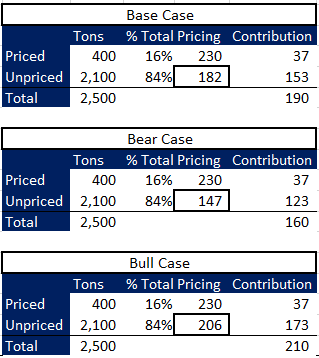
I suspect that ARCH will continue its recent split of 25% Domestic contracting in 2022, even though they did not have this locked up by the 3Q call as they normally do. While they locked the first 4% of demand (400K tons) at $230/ton, I am assuming the next batch of contracting comes in lower in all cases.
For seaborne, I am basically following the structure of the SGX futures curve (this should be a decent enough proxy for USEC where I don’t have access to the futures data). I am probably too conservative in the 1st quarter, as the curve is at $338 for January and $270 on the March contract (don’t forget to adjust for MT/ST and transport), plus you might price some 1st quarter vessels with lagged pricing from the 4th quarter. In any event, think of this case as basically what the playing field is giving you as of right now. I spit out $1.35 billion of segment-level EBITDA and $1.1 billion of free cash flow. If you want to nitpick, there may be some residual cash taxes even though ARCH has some massive NOLs (though this would likely make my steady state 20% cash tax rate overly punitive, i.e. if they have to chew through the NOL over a few more years). If you want to nitpick further, there may be some net working capital investment.
Ok so how does this all shake out into a two-step model? A $246 price target! Let’s see below. Please also note that I have revised Thermal a bit lower since the last time I wrote about ARCH to account for the sell-off in Seaborne Thermal that might impact West Elk (though management said West Elk was sold out on the last call so we could have a debate there). As is usual, I will make the disclaimer that the buyback really impacts the convexity here. If you zero out the buyback and just build a ton of net cash, the price target would be $80 lower. I know it sounds crazy, but of course it’s crazy. We are talking about a $1.5B market cap company generating $1.1B of free cash flow and using 70% of that cash for buybacks. It’s wild.
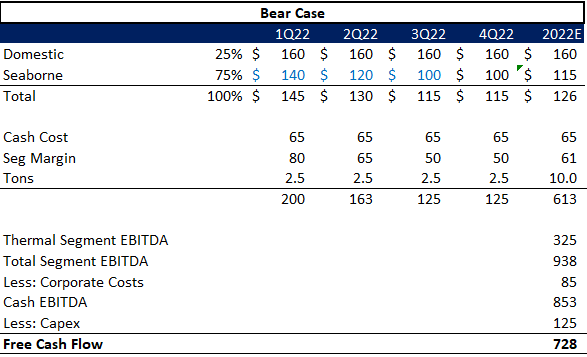
I won’t spend a ton of time on the bull and bear cases, I will just post the tables below. In the bear, I take domestic contracted Met down to $160 (implies the company prices the remaining 2.1M tons at $147, see math below) and take seaborne on a journey over the Niagara Falls. I am not even sure if it’s possible for prices to fall as drastically as I am implying in the 1st quarter, but let’s just pretend they can.
The bear case Met scenario still spits out a highly attractive outcome - $166 price target that would go to $139 without buybacks. I think this is a good place to address the rational question: How can you say that a bad scenario for ‘22 still results in that much upside?! The answer is simply that the market is implying an insanely low multiple on ‘23 and beyond normalized FCF. I have used a 6.1x FCF multiple which is a blend of 7x for Met and 1x for Thermal. To get to $90 per share, you would need to cut that multiple to 2.7X free cash flow, for a low on the cost curve producer with nearly two decades of reserve life. That’s what the market is daring you to do, really. The market at $90 is essentially saying, China is about to go into a protracted decline in Steel production, supply is not going to react, and hence we are in for multiple difficult years. Your apparent multiple will look a lot higher that 2.7x as margins on Met will be very low until supply adjusts to the China implosion scenario.
For the bull case, I price remaining domestic at $206, which results in a $210 blended average. I then have Seaborne staying strong into the 2nd half, with $180/ton realized at the mine. This is where number go bananas. Again, buyback. Zero it out and instead of a $360 target you would have a $180 target.
Phew, that’s been a long journey. I wanted to make a somewhat nuanced point on buyback price assumption. I am currently modeling a buyback price of $95. In a world where the stock continues to lag, a lower buyback price assumption allows for substantially lower Met pricing realization without moving the price target. As an example, in my base case, Met realizations are $168 and this spits out a price target of $246. If I take the buyback price to $80 instead of $95, I can adjust realization down to $149 and the price target is unchanged. I know this feels like a silly Excel exercise, but it might actually be a good proxy for how this all plays out. We saw what just happened to the stock as Met indices as made their initial descent from ‘INSANE’ to merely “RIDICULOUS”. We almost certainly have another 20-30% to go just to get to some semblance of normality. I would not be surprised to see another bout of weakness in the stock, giving management the opportunity to buy their stock much lower than would otherwise be expected.


short interest is 26%. This may additional rocket fuel if you are right on the above. But it also may an indication that you are missing something (i.e. not just an neglected unloved ESG dog house business). Any thoughts on who the shorts may be and why the oversized shorts? I'd also second recording the spaces. Really enjoying your work
Uh i didnt read a time or date about the space ?